
What Is a Psychrometric Chart? Understanding Temperature, Humidity, and Air Moisture
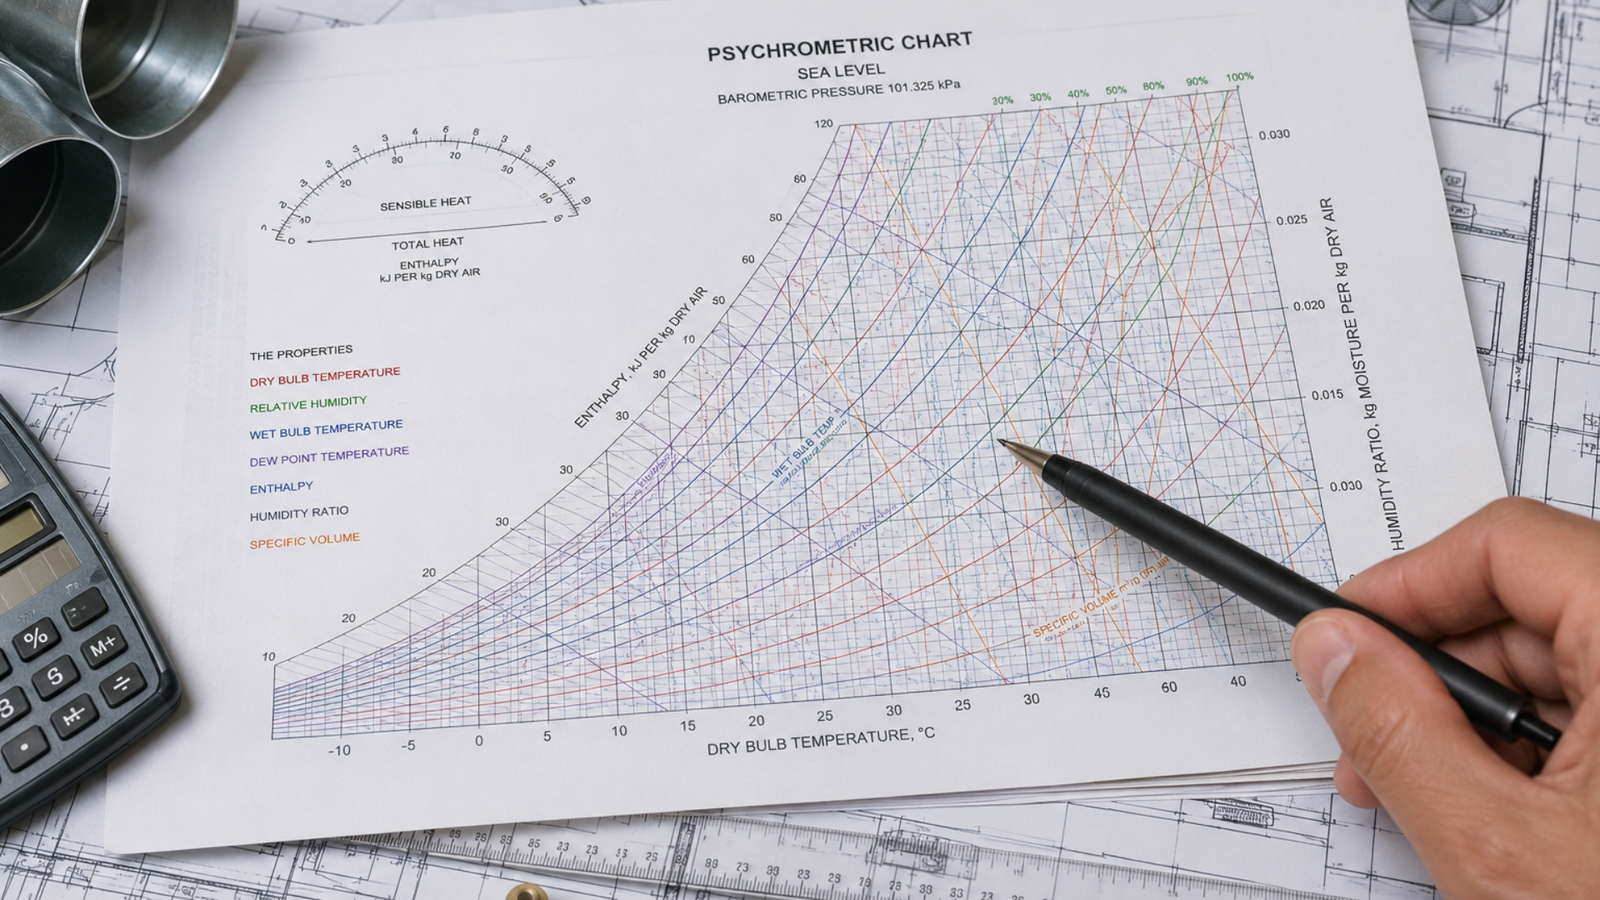
A psychrometric chart refers to a graphical tool that depicts the relationship between temperature, humidity, and moisture. It simply shows how temperature, humidity, and heat content interact with a mixture of air and water vapor, and how they relate to one another. This tool is mainly used by engineers and technicians to predict how the air will behave. The chart helps a designer interpret several important air properties, including wet-bulb and dry-bulb temperature, relative humidity, humidity ratio, dew point temperature, specific volume, and enthalpy (total heat content).
This tool is very useful in estimating humidity loads, assessing condensation risk, evaluating humidity problems, designing humidification or dehumidification systems, and reviewing outdoor air impacts. The blog further discusses why the psychrometric chart is important and how they matter in cold rooms. So, keep reading to learn more.
What is a Psychrometric Chart and How to Read it?
A psychrometric chart illustrates how air is likely to behave when its temperature and moisture content change, making it one of the most valuable tools. As for psychrometric chart reading, you should first find any two properties of the air, such as dry-bulb temperature and relative humidity, and then locate where two corresponding measurement lines intersect on the grid. The next step is to plot a single point at that exact crossing location. You can thus read the remaining unknown air properties by following the surrounding grid lines from that point.
Why is it Important to Learn About the Psychrometric Chart
Mastering the psychrometric chart is crucial to learn about air properties and their interactions. It helps you know how different humidity parameters relate to each other, which is especially important for designing and controlling HVAC systems. Being proficient with the chart helps make more accurate measurements, leading to better energy efficiency and environmental control. Investing time in learning about this tool will be quite helpful in making better, informed decisions in your field. You not only boost your professional skills but also contribute to effective environmental control solutions.
The Role of the Psychrometric Chart in Cold Storage Facilities
A psychrometric chart can be very helpful in cold storage facilities because when warm, humid outdoor air enters a refrigerated environment, moisture can condense or freeze on surfaces. This can result in several operational problems, product quality issues, and safety concerns. Proper psychrometric analysis helps determine moisture infiltration rates and size dehumidification equipment as required. Being educated about dew points, humidity ratios, and airflow requirements can prevent buildup of ice while helping maintain optimal storage conditions. In addition, a psychrometric chart helps with energy efficiency planning. This is because refrigeration is energy-intensive and learning air enthalpy helps optimise equipment run-times and cooling loads.
Why Does Choosing the Best Cold Room Solution Matter?
Choosing the ideal cold room solution is crucial as it utilises psychrometric data and analysis during the engineering phase. A psychrometric chart is commonly used in cold room design to map and control air temperature, moisture levels, and total heat energy, so that stored products do not waste away or spoil. Firstcool is one of the leading cold storage manufacturers in Dubai, UAE, with over 30 years of experience in the field. Firstcool offers several services, including manufacturing, installation, and maintenance of temperature-controlled storage systems.
Firstcool is led by experienced professionals and is known for long-lasting reliability and providing freshness of products. They specialise in delivering a wide variety of high-quality products and services designed to meet the needs of clients across the UAE. If you are looking for a professional, experienced cold room service team, then Firstcool is a great choice.
Conclusion
The psychrometric chart is said to be one of the most powerful tools in industrial ventilation engineering, as it helps explain complex relationships among temperature, humidity, airflow, and energy. Understanding the psychrometric chart can be useful in making better decisions about humidity control, heat removal, energy efficiency, and indoor air quality. This tool ensures that the ventilation systems support safety, integrity, and operational performance.
Choosing the right cold storage facility matters, as they utilise the psychrometric chart to measure, analyse, and control the temperature, humidity, and moisture content of the air. One of the prominent cold room services in Dubai, UAE, is Firstcool, which offers complete, professional cold room solutions. Firstcool is known to provide tailored solutions that ensure efficiency, reliability, and long-term performance. Choosing Firstcool can be a good call if you’re looking for experienced and premium cold room services.
Frequently Asked Questions
Why do HVAC engineers need a psychrometric chart?
Understanding a psychrometric chart is crucial for HVAC engineers as it helps with system design, saves energy, prevents problems such as condensation, mold, freezing, and corrosion, and controls air quality.
How to find humidity from a psychrometric chart?
You need to know the air properties, such as dry-bulb temperature and wet-bulb temperature, or dry-bulb temperature and relative humidity, to find the intersection point on the grid.
What are the different types of psychrometric charts?
Psychrometric charts are commonly differentiated by their temperature range, unit system, and format.
